Category: Crypto

shape
shape
shape
shape
shape
shape
shape
shape
Standard

Bitcoin: 4H Higher Low Confirms Momentum.

After some drama with the SEC’s X account, Bitcoin has continued to stay in line with the short term momentum. A higher low has been established around the 44,500 level (blue arrow). This configuration continues to favor the possibility of a higher high which can be well into the 48K area over the coming days. Also take note of the 4 Hour pin bar, an ideal sign of strength coming off a noted support area. The 48K to 50K area is what I consider a higher probability bearish reversal zone (best for aggressive day trades only). Otherwise use this strength as an opportunity to take profits on other alt coin positions. Also as a reminder the CPI report comes out tomorrow in the early AM EST. Any surprises can have a significant affect on the Dollar, S&P, etc.  

Standard

XRPUSD Signal Analysis.

XRPUSD trade scanner signal was generated near the blue arrow. The trade was worth a small profit before momentum turned the opposite way. Here are some extra points to consider for this idea: The .5900 area (blue line) is an old support / new resistance. IF bearish momentum is going to persist, price should NOT retest this level. Since the break of the .5900 level, price has been consolidating. While the near term trend can be considered bearish, momentum is conflicted possibly because of strength in Bitcoin (the leader). Which may also explain this hesitation to take out lows. For this reason, XRP is gong to be a tough trade because while it may be relatively weak, it is fighting the bullish momentum of Bitcoin. It is probability a better idea to consider signals that are in line with the sector leader, not against it. Consider this is high risk signal.

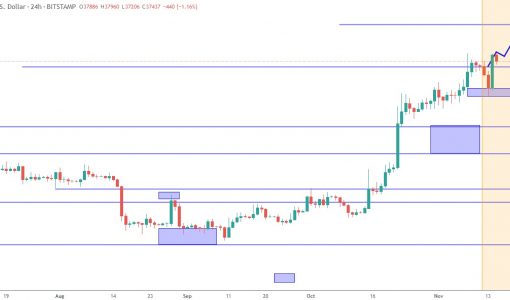
Bitcoin: Continuation To 40K?

Bitcoin has pushed into the 37K resistance and has yet to produce a meaningful pullback on the daily time frame (see my recent articles). There is another momentum continuation pattern that has yet to confirm on the daily time frame now (inside bars). Upon a break of 37,500K a new long signal will be in effect which can lead to a test of the 40K resistance. For weeks I have been saying that a test of 40K was a low probability and here we are only a couple of thousand points away. And now I believe 40K is a reasonable probability. Why the change of mind? 1) I follow price structure and gauge probabilities, NOT try to forecast the future especially from anecdotal opinions. 2) I accept that markets are RANDOM and that anything is possible. 3) I evaluate possibilities based on market evidence and IF markets can prove a new scenario, I am open to adjusting. I don’t get stuck on hunches, opinions or previous analysis. Also it is very important to keep in mind that anyone claiming they correctly called this earlier in the year has done so by mere coincidence. 6 months ago, there was NO WAY to know about the events and outcomes between the SEC court cases and ETF drama that we have seen in recent weeks. Bitcoin could have easily gone the other way if these outcomes had not come out favorable. Especially in light of where we are in terms of interest rates. As you can observe, Bitcoin continues to grind higher without any significant retrace. The next support is around the 35K area (minor) and 32.5K area (major). Price may or may not retest these areas, its not about “will they?” its about “if they test” then new lower risk entry opportunities may come about on this time frame. Until then, the higher price climbs, the greater the risk. Mitigate by reducing exposure: work on the swing trade and day trade time frames only. Bullish momentum is intact until price proves otherwise. In this case, these key support levels would gave to be cleared. Until then, longs have a higher probability, shorts are extremely aggressive. Thank you for considering my analysis and perspective.